Following the first oil crisis, the steel industry made full use of the world's most advanced technologies to achieve energy savings of approximately 20% during the 1970s and '80s.
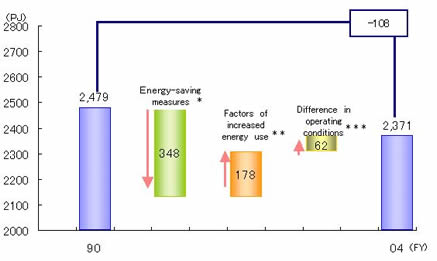
An overview of the progress made in energy conservation during the decade of the 1990s shows that energy use in 2004 was 108 PJ less than in 1990, i.e. the equivalent of about 2.8 million kiloliters of crude oil.
This total breaks down as follows: energy savings of 348 PJ made possible by investments in energy-saving equipment and operating improvements; an increase of 178 PJ in energy use resulting from efforts to market higher value-added steel products and to reinforce environmental-protection measures; and energy increase of 62 PJ due to lower steel output and other factors.
Note PJ: Petajoule (1015 joules); 1 cal.: 4.18605J; 1 PJ: About 25,800 kiloliters in crude oil equivalent
*Energy-saving measures
Investments in energy-saving equipment
Operation improvement
Increase in low-grade coal use and PCI operations
**Factors of increased energy use
Environmental-protection measures
Increased energy use due to enhanced recycling
Higher value-added products
Operation changes
Superannuating of equipment
***Difference in operating conditions
Effects of production volume
Others
In the 1970s and 1980s, efforts to save energy focused on improving productivity through the elimination and integration of certain production processes (resulting in the development of continuous casting and continuous annealing etc.) and on the introduction of large-scale waste energy recovery equipment.
During the 1990s, in spite of accelerated energy consumption caused by new factors such as the pursuit of high added value and the need for environmental-protection measures, energy savings were realized by such means as the reinforcement of waste energy recovery equipment, higher efficiency in the operation of in-plant power generation equipment, and the recycling of plastic waste materials,etc.
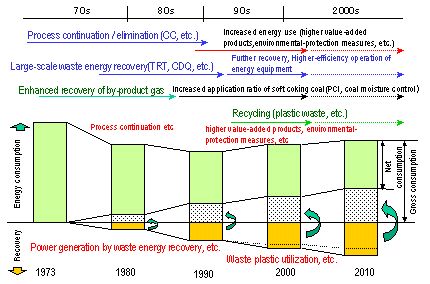
PCI (Pulverized Coal Injection) - Technology to inject pulverized coal into blast furnaces for the elimination of coking process CDQ (Coke Dry Quenching) - The unit recovers the heat of coke produced in a coke oven as steam.
TRT (Top-pressure Recovery Turbine) - The unit produces electric power using the pressure of gas generated form a blast furnace operated under an elevated pressure.
The steel industry has used a variety of energy-saving measures to achieve the highest levels of energy efficiency in the world. The key factor underlying this accomplishment is the high rate at which waste energy recovery equipment has been adopted in addition to the industry's comprehensive technological capabilities in such areas as production and operations.
Approximately 100 PJ waste energy recovered by 1990; In the 1990s the recovery expanded to 20 PJ
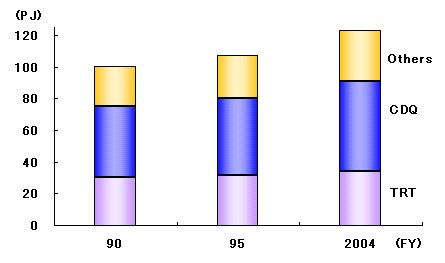
Rapid adoption in the late 1990s; Large potential in enhanced energy saving due to a wider range of target equipment for regenerative burner installation